- Home
- Market Failure
- Excess Demand

Excess Demand in Economics, Explained with Graphs
Economists sometimes use the term excess demand to describe a situation of disequilibrium in the market for a particular good or service. In most situations this is nothing to be concerned about, because it is just a temporary phenomenon that will quickly auto-resolve itself via the forces of supply and demand and the price discovery mechanism.
The excess demand meaning (which is sometimes called unsatisfied demand) is that there is a potential profit opportunity for any firm that can increase supply to meet that demand.
For example, if prices are too low for a product, there will be more demand from customers wishing to purchase that product than suppliers can accommodate. This excess demand will soon create shortages of that product and, if producers are free to raise prices and output, they will do so until a new equilibrium is reached.
Supply & Demand Equilibrium
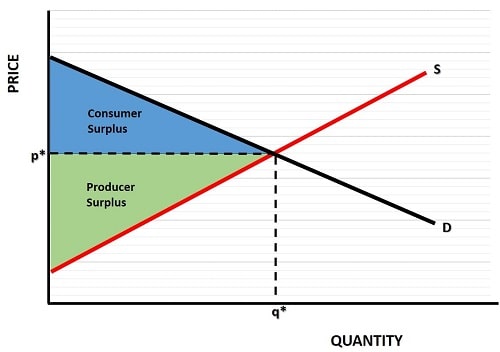
In the graph below I have illustrated a market that is in equilibrium. At a price of p the market clears at a quantity of q, there is no excess supply or demand, and both buyers and sellers are satisfied.

I've illustrated the concept of consumer surplus and producer surplus in the graph because, as I'll show below, these are affected when there is excess demand in the market.
Consumer surplus is illustrated by the blue triangle below the demand curve and above the market price. The surplus here is gained by all those consumers who purchased the product at price p even though many of them would have been prepared to pay more.
This occurs because each customer values goods differently even though everyone pays the same price (assuming that there is no price-discrimination in the market).
The same reasoning applies to producer surplus. Each seller receives the same price (p) even though some sellers would have been prepared to sell for a lower price. Producer surplus is illustrated by the pink area below the price and above the supply curve.
Next we'll consider what happens to price and quantity when the government decides to intervene in the market to restrict the price. Examples of excess demand resulting from price restriction policies are commonplace, with most typically being used in times of economic upheaval.
The Excess Demand Graph Explained

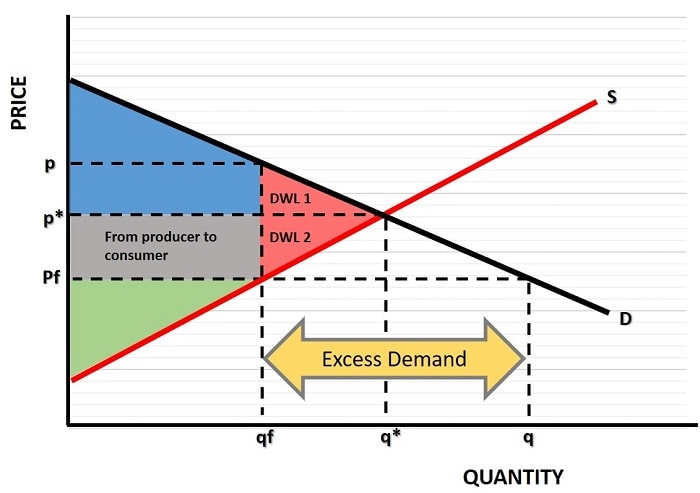
In the graph above, the equilibrium price and quantity is p* and q* if left to market forces.
However, suppose that the government is unhappy with the market price and decides to restrict it in order that it can become more affordable for consumers. The government fixes the price at Pf, a price at which consumers would like to increase their purchasing of the product all the way up to a new quantity of q.
Unfortunately for those consumers, producers are not so happy with the new price as it reduces their ability to make a profit. At a price of Pf, producers will only be willing to supply a quantity of qf which, contrary to the hopes of consumers, is actually lower than the original quantity of q*.
The difference between the quantity that consumers demand, and the quantity that producers are prepared to supply, gives us the excess demand measure (equal to q - qf).
Consumer Surplus, Producer Surplus, and Deadweight Loss
Sticking with the excess demand graph analysis, we can clearly see from the graph that there have been changes to the surpluses gained by consumers and producers as a result of the price fixing. We can even use the graph to assess whether or not society as a whole has gained or lost out from the government intervention.
Consumer surplus seems to have done okay, it has been reduced by a small amount due to the lower supply from producers. However, there is a large gain in surplus due to the extra blue area, which has been gained at the expense of producers. Remember that consumer surplus occurs above the price but below the demand curve, meaning that some of the original producer surplus has been transferred to consumers, as shown by the darker blue area.
Producer surplus has been reduced dramatically, not only do they lose surplus to consumers, they have also lost some surplus that they used to gain at the previous higher price and output level..
Overall, society is worse off because consumers gain less that producers lose. The difference is called the deadweight loss (DWL), and this is illustrated in the graph by the dark gray DWL area.
This constitutes a net loss to society because neither consumers nor producers can capture this lost surplus at the new lower fixed price, even though it was originally being captured by the market when it was in equilibrium, before the unfortunate government intervention.
Market Shortages - The Big Problem with Excess Demand
It may occur to some readers that, so long as consumers are better off, who cares about producers? The answer is that even consumers ultimately lose out. It is, of course, all well and good for those consumers who manage to obtain the products they desire at the fixed lower price, but for many consumers those products simply will not be available (or if they are they may only be available on a black-market at much higher prices).
The shortages that arise from excess demand at the lower price are a real problem for all consumers if the product is something that is essential, and needed on a frequent basis. In this case, even those customers who were initially lucky enough to obtain goods, will soon face problems obtaining them in subsequent shopping attempts.
Examples of Excess Demand Examples
Many excess demand examples (resulting from fixed prices) can be found in the former USSR economies, where everyday food items were simply unavailable during the communist era. People would line up for hours at a time trying to obtain bread from bakeries and shops, only to be met with bare shelves. It's a common misconception in the west that the people of those countries had no money, they did have money, they just couldn't use it to buy enough of the goods that they needed.
Supply line difficulties associated with the 2020-23 global pandemic give us another example, because it caused some resurgence of government price control policies, as explained in this article by 'The Conversation'.
As Milton Friedman noted:
"We economists don't know much, but we do know how to create a shortage."
The point in both of these examples of excess supply is that the shortage problems they create can apply to more or less all products throughout the entire economy, and not just to specific products or industries. Shortages of any given product are much less of a problem because there will likely be a plentiful supply of a substitute good that can be purchased instead.
When shortages occur for lots of different products then it will likely put pressure on inflation to increase, or for goods to be sold on a black market thereby evading official price controls.
The rationing of products that existed during and after World War 2 came with severe disruption to the forces of supply and demand and, sure enough, black markets soon emerged to facilitate trade. The extent to which the authorities were aware of these markets, and simply tolerated them, or were unaware is debatable. In either case the result creates many problems, and it is to be hoped that such price controls can be avoided in future.
Excess Demand Formula (or Function)
In elementary economics you may come across problems that ask you to calculate excess demand given two simple functions. These functions, for supply and demand, are typically expressed as linear equations of the form Y = MX + C. For example, suppose that supply and demand are given as:
- Supply = 2p + 80
- Demand = 100 - 3p
To find the equilibrium price you simply need to the value of 'p' where supply equals demand. This is where 2p + 80 = 100 - 3p and some simple algebra reduces this to 5p = 20 (i.e., add 3p to both sides of the equals sign, and deduct 80 from both sides). Then simply divide both sides by 5 to get the equilibrium price of p = 4.
You can prove this by substituting 4 into the supply and demand functions above to verify that you arrive at an equal quantity supplied and demanded:
- Supply = 2(4) + 80 = 88
- Demand = 100 - 3(4) = 88
So, supply equals demand at an equilibrium price of 4 and quantity of 88.
Now, if the market price is fixed below 4, say at p = 3, then there should be some excess demand. Working through the functions again gives:
- Supply = 2(3) + 80 = 86
- Demand = 100 - 3(3) = 91
Clearly this is not an equilibrium point and there is unsatisfied demand of 91 - 86 = 5.
Long Run Market Equilibrium
The extent to which demand will continue to exceed supply in the long run will depend upon how long it takes the government to allow the market equilibrium price to be restored. Any permanent fix that prevents the equilibrium price from clearing the market will likely lead to an illegal black market (sometimes called an informal market) where goods can be bought and exchanged behind the back of the authorities.
The need for a black market will emerge because people are resourceful and wherever there is unsatisfied demand for a product there will be an opportunity for profits to be made if new supply can be brought to market for sale. Black markets nearly always develop during times of rationing and price controls, and it is likely that we will again witness these things if, for example, our governments adopt incomes policies and price controls to battle against inflation.
Related Pages:
About the Author
Steve Bain is an economics writer and analyst with a BSc in Economics and experience in regional economic development for UK local government agencies. He explains economic theory and policy through clear, accessible writing informed by both academic training and real-world work.
Read Steve’s full bio
Recent Articles
-
What Happens to House Prices in a Recession?
Jan 11, 26 03:13 AM
What happens to house prices in a recession? Learn how different recessions affect housing, why 2008 was unique, and how policy responses change home values. -
Does Government Spending Cause Inflation?
Jan 10, 26 06:01 AM
Does government spending cause inflation? See how waste, crowding out, and stimulus spending quietly push prices higher over time. -
What Happens to Interest Rates During a Recession
Jan 08, 26 05:31 PM
What happens to interest rates during a recession? Explore why rates often fall, when they don’t, and how inflation, policy, and markets interact. -
Circular Flow Diagram in Economics: How Money Flows
Jan 03, 26 04:57 AM
See how money flows through the economy using the circular flow diagram, and how spending, saving, and policy shape real economic outcomes. -
What Happens to House Prices During Stagflation?
Jan 02, 26 09:39 AM
Discover how house prices and real estate behave during stagflation, with historical examples and key factors shaping the housing market.