- Home
- Production Possibilities Curve
- Producer Surplus

Producer
Surplus Explained (Graph, Formula & Examples)
Producer surplus is a concept in economics that refers to the difference between the amount of money that a producer is willing to accept in payment for a good or service, and the amount that they actually receive. This surplus serves as a measure of producer profitability and overall market health.
At its core, producer surplus highlights the benefits producers gain from market transactions. When the market price of a good exceeds the minimum acceptable price, producers enjoy a surplus, which can be reinvested into the business for growth and development. This reinvestment can lead to improved production processes, better quality products, and enhanced market presence.
The importance of producer surplus extends beyond individual businesses. It plays a critical role in the overall economy by encouraging production and innovation. When producers experience a surplus, they have more resources to invest in expanding their operations, increasing production capacity, and improving product quality. These investments lead to higher productivity and efficiency, which are key drivers of economic growth.
As businesses grow and thrive, they contribute to overall economic development by creating jobs, increasing consumer spending, and generating tax revenue. Economic growth, in turn, creates a positive feedback loop that boosts consumer confidence and spending power. This leads to increased demand for goods and services allowing producers to sell their products at even higher prices, thereby further increasing their surplus.
Producer
Surplus Graph

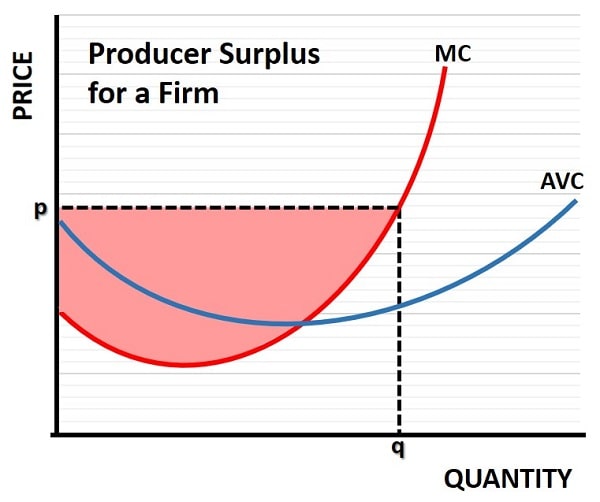
In the producer surplus graph above, which relates to a single competitive firm rather than an entire industry, the market price is a given and is set at p. At price p the firm will maximize its profit by producing a quantity of output whereby the marginal cost (MC) of producing one additional unit of output is just equal to the price that the firm receives for producing it.
As can be seen in the graph, this gives a quantity of q.
The average variable cost (AVC) curve shows the average cost of producing all output excluding a fixed cost component that is unrelated to output. When MC is lower than AVC, the AVC curve is falling, and when MC is higher than AVC, the AVC is rising. Therefore, MC intersects AVC at its lowest point. For more info on these cost curves, see my articles at:
Producer surplus is illustrated in the graph above by the pink shaded area. It is that area that is above the MC curve but below the dashed price line.
Factors
Influencing Producer Surplus
Several factors influence producer surplus, each playing a crucial role in determining the profitability and competitiveness of a business.
- One of the primary factors is the cost of production. Lower production costs enable producers to sell their goods at competitive prices while maintaining a healthy surplus. Factors such as raw material costs, labor expenses, and overheads directly impact the cost of production. Efficient production processes and economies of scale can significantly reduce these costs, enhancing producer surplus.
- Market demand is another critical factor affecting producer surplus. When demand for a product is high, producers can charge higher prices, resulting in increased surplus.
- Government policies and regulations i.e., supply-side economics, also play a significant role in shaping producer surplus. Policies related to taxation, trade, labor, and environmental regulations can impact production costs and market prices.
Producer
Surplus Examples
- Apple has consistently achieved high producer surplus by focusing on premium pricing, product innovation, and efficient supply chain management. By creating high-demand products with strong brand loyalty, Apple can charge premium prices that exceed production costs, resulting in substantial surplus.
- Tesla has maximized its producer surplus by leveraging advanced manufacturing technologies and vertical integration. By producing key components in-house and utilizing automation, Tesla has reduced production costs and increased efficiency. The company's focus on innovation and sustainability has also driven high demand for its electric vehicles, allowing Tesla to achieve significant producer surplus.
- Amazon Inc. is another company that has successfully maximized producer surplus through its e-commerce platform and efficient logistics network. By offering a wide range of products and leveraging data analytics, Amazon can effectively target and attract customers, driving demand. The company's advanced logistics network and economies of scale enable cost-effective operations, reducing production costs and increasing surplus.
Consumer
Surplus and Producer Surplus
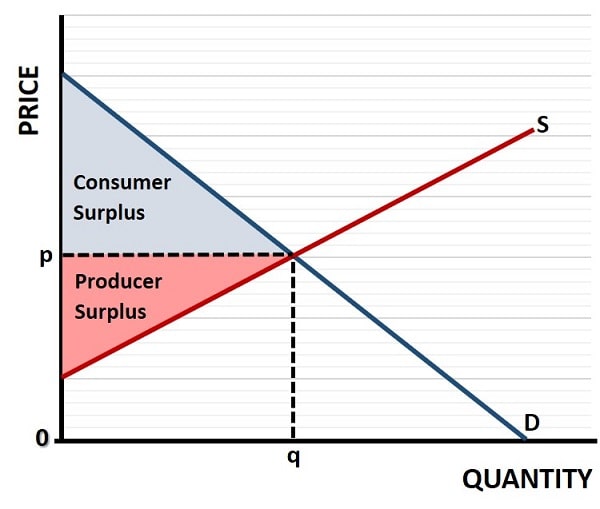
In economics, consumer surplus and producer surplus together form what is known as economic surplus or total welfare in a market. While producer surplus represents the benefit to sellers, consumer surplus reflects the benefit to buyers i.e., the difference between the maximum price consumers are willing to pay and the actual price they pay.
On a standard supply and demand graph (see below), consumer surplus is the area above the market price and below the demand curve, while producer surplus lies below the market price and above the supply curve.

In perfectly competitive markets, the equilibrium price and quantity (p and q in the graph) maximizes total surplus, meaning resources are allocated in the most efficient way possible. Any distortion, such as taxes, price floors, or ceilings, can reduce total surplus by creating a deadweight loss, which is a key concept in welfare economics.
Producer
Surplus Formula
Producer surplus can be expressed mathematically to aid in analysis and graphical representation. The basic formula is:
Producer Surplus = Total Revenue – Total Variable Cost
Alternatively, when analyzing linear supply and demand curves, producer Surplus = ½ × Base × Height, where the base is the quantity sold, and the height is the difference between the market price and the minimum price at which producers are willing to sell.
For students using graphs, producer surplus is the area above the supply curve and below the market price, from the y-axis to the equilibrium quantity. In calculus-based microeconomics, where non-linear supply curves and demand curves are used, the formula becomes:
Producer Surplus = ∫ (P – MC) dQ,
where P is the market price, MC is marginal cost, and Q is the quantity.
Measuring
Producer Surplus in Practice
Several tools and techniques can be used to measure producer surplus accurately. One common method is cost-benefit analysis, which compares the costs of production with the revenue generated from sales. This analysis helps businesses identify areas where they can reduce costs and increase surplus.
Economic modeling and data analytics provide valuable insights into market dynamics and pricing strategies. Analysis of historical data and market trends allows businesses to forecast demand and set optimal price/output combinations. Advanced analytics tools, such as machine learning and artificial intelligence, can enhance the accuracy of these forecasts and provide actionable recommendations for maximizing surplus.
Surveys and customer feedback are also important tools for measuring producer surplus. By understanding consumer preferences businesses can tailor their products and pricing strategies to maximize surplus.
FAQs about Producer
Surplus
How does price elasticity of supply impact producer surplus?
How does price elasticity of supply impact producer surplus?
When supply is more elastic, producers can respond more easily to price increases, potentially increasing producer surplus. However, if supply is inelastic, surplus may be more limited even when prices rise, due to production constraints.
Can producer surplus
exist in a monopolistic market, and how does it differ from perfect
competition?
Can producer surplus
exist in a monopolistic market, and how does it differ from perfect
competition?
Yes, producer surplus can exist in monopolistic markets, but it may be inflated due to pricing power rather than efficient production. In contrast, in perfect competition, surplus arises purely from cost-efficiency and market equilibrium.
How do changes in
input prices (like raw materials or energy) affect producer surplus over time?
How do changes in
input prices (like raw materials or energy) affect producer surplus over time?
Rising input costs reduce the margin between production cost and sale price, thereby shrinking producer surplus, unless producers can pass costs onto consumers. Long-term input volatility can influence strategic sourcing and automation investments.
What is the
relationship between innovation cycles and producer surplus in tech-driven
industries?
What is the
relationship between innovation cycles and producer surplus in tech-driven
industries?
In fast-moving industries, firms that innovate frequently enjoy temporary monopolies, premium pricing, and larger producer surpluses. However, these cycles are short-lived, and surplus erodes as competitors catch up or technology becomes commoditized.
How do international
trade agreements affect producer surplus in export-driven economies?
How do international
trade agreements affect producer surplus in export-driven economies?
Trade agreements can expand market access and increase demand, boosting prices and producer surplus. However, exposure to foreign competition may compress margins for less efficient domestic producers, reducing their surplus.
What role does behavioral economics play in shaping producer
surplus?
What role does behavioral economics play in shaping producer surplus?
Understanding consumer behavior, cognitive biases, and perceived value enables firms to tailor offerings and prices more effectively, helping extract more surplus by aligning with psychological price thresholds.
Conclusion
Policymakers have a significant role to play in shaping producer surplus. By creating a business-friendly environment with supportive policies and regulations, governments can encourage investment, innovation, and economic growth.
For economics students, this highlights the intersection between microeconomic theory and macroeconomic outcomes. Policies that impact production costs, such as subsidies, tax incentives, or regulatory reforms, alter the shape and position of the supply curve, thereby affecting producer surplus. Similarly, policies that influence market demand, such as consumer stimulus programs or trade agreements, indirectly affect producers by shifting demand curves.
Studying producer surplus not only helps in understanding firm behavior but also serves as a lens through which students can evaluate the efficiency and equity outcomes of public policy.
Related Pages:
About the Author
Steve Bain is an economics writer and analyst with a BSc in Economics and experience in regional economic development for UK local government agencies. He explains economic theory and policy through clear, accessible writing informed by both academic training and real-world work.
Read Steve’s full bio
Recent Articles
-
What Happens to House Prices in a Recession?
Jan 11, 26 03:13 AM
What happens to house prices in a recession? Learn how different recessions affect housing, why 2008 was unique, and how policy responses change home values. -
Does Government Spending Cause Inflation?
Jan 10, 26 06:01 AM
Does government spending cause inflation? See how waste, crowding out, and stimulus spending quietly push prices higher over time. -
What Happens to Interest Rates During a Recession
Jan 08, 26 05:31 PM
What happens to interest rates during a recession? Explore why rates often fall, when they don’t, and how inflation, policy, and markets interact. -
Circular Flow Diagram in Economics: How Money Flows
Jan 03, 26 04:57 AM
See how money flows through the economy using the circular flow diagram, and how spending, saving, and policy shape real economic outcomes. -
What Happens to House Prices During Stagflation?
Jan 02, 26 09:39 AM
Discover how house prices and real estate behave during stagflation, with historical examples and key factors shaping the housing market.