- Home
- Production Possibilities Curve
- Supply Curve

Supply
Curve Explained (Graphs & Real Examples)
The supply curve is a graphical representation of the relationship between the price of a good or service and the quantity that producers are willing to supply. All else being equal, an increase in the price of a good will result in an increase in the quantity supplied, and a decrease in the price will lead to a decrease in the quantity supplied.
This positive relationship is depicted by the upward-sloping supply curve, which illustrates how producers respond to changes in market prices. This principle is rooted in profitability. Higher prices make it more attractive for producers to increase output, because they can cover higher production costs and earn greater profits.
For example, if the price of wheat rises, farmers are incentivized to plant more wheat, even if it means reallocating resources from other crops or investing in additional land and equipment.
However, the law of supply operates within certain constraints:
- In the short-run, producers face limitations such as available resources, and technological capabilities. These constraints can restrict the ability to increase supply in response to rising prices, but labor input is still considered flexible in the short-run, so output does still rise at higher prices.
- In the long-run, producers can adjust their production processes, invest in new technologies, and expand capacity to fully respond to price changes.
As with the demand curve, the formalization of the supply curve is most credited to Alfred Marshall in his 1890 book ‘Principles of Economics’.
Supply Curve
Graph & Schedule
The market supply curve cannot easily be estimated by simply summing up all the individual supply curves of each producer. The reason is because, at the market level, an increase in supply will tend to push up production costs due to higher input costs (input demand increases as market supply increases, thereby raising costs).
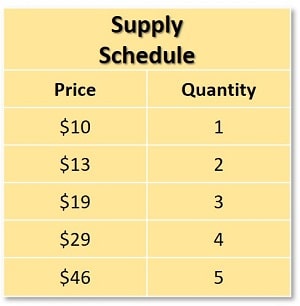
To get an idea of market supply, economists compile a market supply schedule that observes how price and output levels vary across a given industry. This involves estimating the price elasticity of supply at various price points.

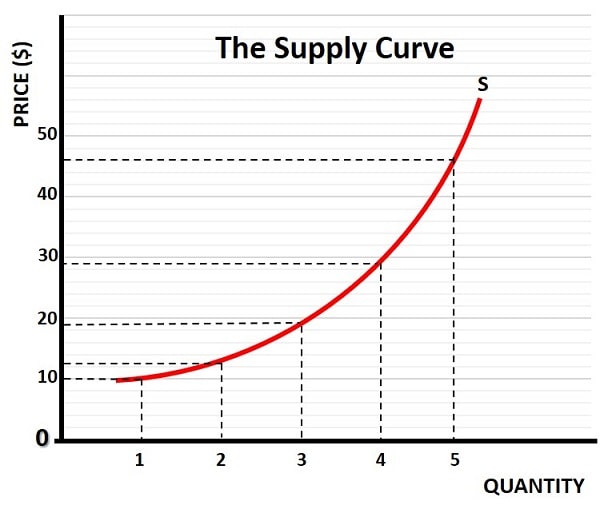
By plotting the supply schedule price and quantity combinations on a graph, we can illustrate the upward sloping market supply curve. Notice that the curve is positively sloped, and that the slope gets steeper as we move along it from left to right. The implication here is that there is an increasing marginal cost of production as the quantity produced increases.
An increasing marginal cost is to be expected because, with a given amount of capital in the short run, producers can only increase labor when it wants to increase production. As more and more labor is added, the quantity of output that can be increased diminishes. Eventually, regardless of price, no more output increases are possible with a given capital stock and we end up with a perfectly inelastic vertical supply curve.

In the long run, of course, capital can also be increased and so there is no limit on quantity. However, supply and demand analysis is usually done with a short run focus, with a simple production function based on two inputs, capital and labor, with capital fixed and labor variable. For long run analysis of supply curves, where all factors of production are variable, the relevant supply curve may be downward sloping, constant, or decreasing. For more info, have a read of my article about:
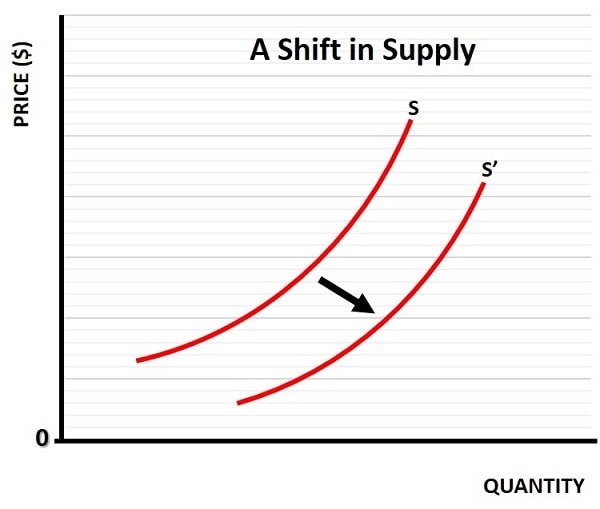
A movement along the supply curve illustrated above occurs when the market price of a product changes, while all other factors are held constant. If one of the other factors changes, we will get a shift of the entire curve.
Factors
Influencing Supply Curve Shifts
A movement along the supply curve occurs only due to a change in the price of the good itself. In contrast, a shift in the supply curve occurs when other factors change. Those factors determine the quantity of goods that producers are willing to supply at given price levels.

One of the primary determinants of supply curve shifts is production costs. When the cost of raw materials, labor, or other inputs rises, the supply curve shifts to the left, indicating that producers are less willing to supply the same quantity as at previous prices. Conversely, a decrease in production costs shifts the supply curve to the right, allowing producers to supply more at lower prices.
Technological advancements also play a significant role in shaping the supply curve. Innovations that improve production efficiency can lead to an outward shift in the supply curve, as they reduce the cost of production and enable producers to supply more goods at the same price. For instance, automation and improved manufacturing processes can significantly increase output and drive down costs, benefiting both producers and consumers.
Government policies, such as taxes, subsidies, and regulations, can also impact the supply curve. Taxes on production can increase costs and shift the supply curve to the left, reducing the quantity supplied at each price level. On the other hand, subsidies can lower production costs and shift the supply curve to the right. Additionally, regulations that affect production processes, environmental standards, or labor laws can either constrain or facilitate supply, depending on their nature and implementation.
In summary the supply curve is influenced by a variety of factors, many of which can cause the curve to shift, the key determinants of supply include:
- Input Prices: When the cost of raw materials, labor, or energy increases, production becomes more expensive, often decreasing supply.
- Technology: Advances in technology can make production more efficient, increasing supply at every price level.
- Taxes and Subsidies: Government interventions such as taxes can raise production costs (reducing supply), while subsidies can encourage greater output.
- Number of Sellers: An increase in the number of firms in the market increases total market supply.
- Producer Expectations: If producers expect future prices to rise, they may withhold supply now, reducing current supply.
- Natural Conditions: Events like weather, natural disasters, or disease outbreaks can significantly affect the supply of agricultural and perishable goods.
Supply Curve
and Market Equilibrium
Market equilibrium is a state where the quantity of goods supplied equals the quantity demanded, resulting in a stable market condition where there is no inherent tendency for price or quantity to change. The supply curve plays a crucial role in determining this equilibrium, because it intersects with the demand curve to establish the equilibrium price and quantity.
When the supply curve shifts, it alters the equilibrium point. For example, if the supply curve shifts to the right due to lower production costs or technological advancements, the equilibrium price will decrease, and the equilibrium quantity will increase. This means that more goods are supplied at a lower price, benefiting consumers while still ensuring profitability for producers.
For more details on the interaction of supply and demand towards equilibrium, see my main article about Price Discovery.
The Role of Elasticity
in the Supply Curve
Elasticity is a measure of how responsive the quantity supplied is to changes in price. Supply elasticity can be categorized as elastic, inelastic, or unitary, depending on the degree of responsiveness.
- When the supply of a good is elastic, a small change in price leads to a significant change in the quantity supplied. This is often the case for goods that can be produced quickly and with flexible resources.
- In contrast, inelastic supply occurs when the quantity supplied is relatively unresponsive to price changes. This is common in industries with long production cycles or limited resources.
- Unitary elasticity is a middle ground where the percentage change in quantity supplied is equal to the percentage change in price.
For more details on this, see my main article about the Price Elasticity of Supply.
Examples: Analyzing Supply Curves in
Different Industries
- Agriculture - Supply is highly sensitive to weather and seasons. A drought can shift the supply curve for crops leftward, reducing quantity and increasing prices.
- Technology - Rapid innovation often shifts the supply curve rightward. For example, improvements in semiconductor manufacturing have dramatically increased the supply of computing power at lower prices.
- Oil and Energy - Geopolitical instability or OPEC decisions can restrict supply, shifting the curve leftward and causing price spikes.
- Healthcare and Pharmaceuticals - Patent expirations can introduce competition, shifting the supply curve rightward as generics enter the market, often reducing drug prices.
Supply Curve
FAQs
Can a supply curve ever slope downward?
Can a supply curve ever slope downward?
Yes, although rare, a backward-bending supply curve can occur in certain labor markets or under decreasing cost industries, where economies of scale or subsidies make it profitable to supply more at lower prices under specific conditions.
How do supply curves function in perfectly competitive vs
monopolistic markets?
How do supply curves function in perfectly competitive vs monopolistic markets?
In perfect competition, individual firms are price takers, so the supply curve is determined by marginal cost. In monopolistic or oligopolistic markets, supply is influenced by strategic pricing, and a well-defined supply curve may not exist in the traditional sense.
What happens to the supply curve when minimum wage laws
change?
What happens to the supply curve when minimum wage laws change?
Increases in minimum wage raise labor costs, which may shift the supply curve leftward for labor-intensive industries, reducing output at each price level unless offset by productivity gains or price increases.
How does supply chain disruption affect the supply curve?
How does supply chain disruption affect the supply curve?
Supply chain issues (e.g., shipping delays, material shortages) increase input costs or reduce availability, causing the supply curve to shift left, reflecting lower quantities available at every price point.
How does the concept of opportunity cost influence the
supply curve?
How does the concept of opportunity cost influence the supply curve?
Producers allocate resources based on where they can earn the highest return. If the opportunity cost of producing one good rises (due to better returns elsewhere), supply for that good may decrease, shifting its supply curve leftward.
What is the role of inventory in shaping short-run supply
responsiveness?
What is the role of inventory in shaping short-run supply responsiveness?
Firms with inventory buffers can respond to price changes without immediately altering production, making the short-run supply curve flatter or temporarily more elastic than it otherwise would be.
Related Pages:
- The Demand Curve
- Aggregate Supply
- Producer Surplus
- Say's Law
- Price Elasticity of Supply
- The Production Function
- Costs of Production
- The Production Possibilities Curve
About the Author
Steve Bain is an economics writer and analyst with a BSc in Economics and experience in regional economic development for UK local government agencies. He explains economic theory and policy through clear, accessible writing informed by both academic training and real-world work.
Read Steve’s full bio
Recent Articles
-
What Happens to House Prices in a Recession?
Jan 11, 26 03:13 AM
What happens to house prices in a recession? Learn how different recessions affect housing, why 2008 was unique, and how policy responses change home values. -
Does Government Spending Cause Inflation?
Jan 10, 26 06:01 AM
Does government spending cause inflation? See how waste, crowding out, and stimulus spending quietly push prices higher over time. -
What Happens to Interest Rates During a Recession
Jan 08, 26 05:31 PM
What happens to interest rates during a recession? Explore why rates often fall, when they don’t, and how inflation, policy, and markets interact. -
Circular Flow Diagram in Economics: How Money Flows
Jan 03, 26 04:57 AM
See how money flows through the economy using the circular flow diagram, and how spending, saving, and policy shape real economic outcomes. -
What Happens to House Prices During Stagflation?
Jan 02, 26 09:39 AM
Discover how house prices and real estate behave during stagflation, with historical examples and key factors shaping the housing market.