- Home
- Aggregate Demand
- Is-lm Model
- Lm Curve

The LM Curve Derived & Explained (with Graphs)
The LM curve introduces money-market equilibrium points to the short-run Keynesian economic model and, together with the IS curve, it completes the important IS-LM Model.
In my previous posts about Keynesian economics I had focused entirely on the goods/services market, and for details on that see the links at the bottom of the page, but the money-market also plays a central role in macroeconomics which we now need to understand.
As with so many markets in economics it's easiest and best to start with a simple supply and demand analysis. The demand for money is a complicated topic of study because it has many different uses. Money-supply is also complicated when we consider how money is created i.e. by both the central-bank (which controls the monetary base) and the high street banks (which control the creation of credit).
Analysis of these complications forms much of the body of economic theory, but we don't need to delve too deeply into those complications on this page.
The task here is to describe a basic model of the money-market in order to complete our Keynesian model of short-run demand management.
As always, keep in mind that this model assumes that there is spare capacity in the economy such that output can be expanded without causing any rise in the price level (see my page about aggregate-supply for clarity on that).
The Demand for Money

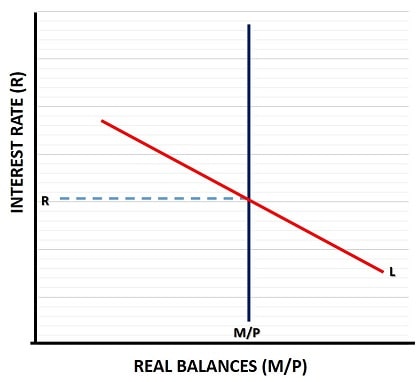
In the diagram above the demand for money is shown via the downward sloping L curve, whilst the supply is shown via the vertical M/S line. This might not look like a typical supply and demand model, not least because the axes are labelled differently from the usual price and quantity measures, but look again.
The price of money is the interest that must be paid for holding it (if it is borrowed money), or the interest that must be foregone for holding it (i.e. the lost interest earnings that could have been made by investing the money).
Similarly, the supply of money is simply the nominal money-supply divided by the price-level (M/P). The price-level is important here, because rising prices erode the real money-supply by reducing its purchasing power. People demand money for many reasons, but their demand is for real money balances with a given level of purchasing power.
In the diagram, the supply of money is vertical with a fixed purchasing power when the price level is stable and the supply of nominal money is fixed.
As with other supply and demand models, equilibrium in the money market is reached at the intersection of the two curves, which gives an interest rate of R as shown.
The LM Curve Derived with a Graph

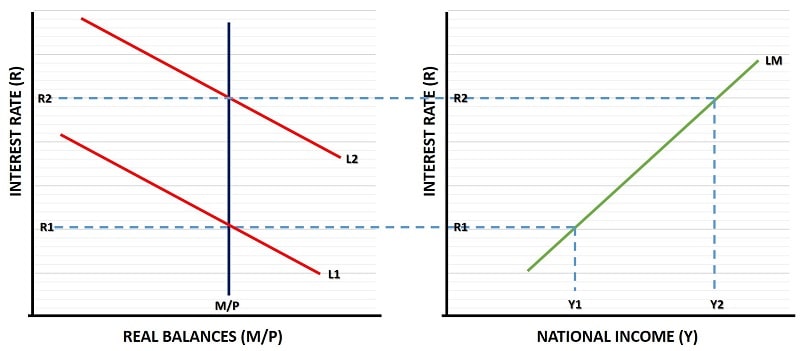
The diagram above shows what happens in the money-market after an increase in national income/output i.e. an expansion in the goods market. With more goods and services being bought and sold there will be an increase in demand for money to facilitate those purchases, and so the demand for money curve shifts from L1 to L2 as illustrated in the left side of the diagram.
The extra demand for money, given the fixed supply of it, causes an increase in the interest rate from R1 to R2, because lenders will now be able to extract a higher price for their money since demand for it has increased.
You might wonder how an increase in income could have come about in the first place since that requires more spending on goods and services but the money-supply is fixed, so how can there have been any extra spending? This can be facilitated by an increase in the 'velocity' of exchange i.e. an increase in the rate at which the existing money stock circulates around the economy.
In reality, of course, the high street banks would be able to create more money in this scenario by simply extending credit lines via the money-multiplier process, but in this model we assume that the central-bank intervenes in the market by raising the base rate of interest (sometimes called the 'bank rate') to whatever level is necessary to hold the money-supply constant.
The central-bank can achieve this by selling bonds at a reduced price (and thus a higher yield or implied interest rate) in order to draw money out of the system to offset the creation of extra credit by the high-street banks.
On the right-side of the diagram, the LM curve is derived by connecting the money-market to national income/output. The curve shows all points at which equilibrium is achieved in the money-market at varying levels of national income. The slope of the LM curve depends on the responsiveness of money-demand to national income, and to the interest rate.
The LM Curve & Monetary Policy
In the section above we derived the LM curve by connecting varying levels of national income with equilibrium in the money-market at a fixed money-supply. If the money-supply is allowed to vary, then the entire LM curve will shift in the same direction. An active monetary policy does exactly that.
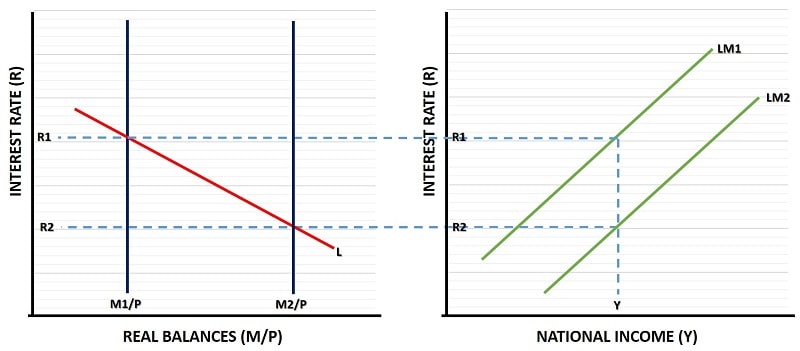
If the central-bank expands the nominal money-supply from M1 to M2 with the price level remaining constant, this would cause a rightward shift of the entire real money-supply as illustrated in the diagram.

Starting with the initial position at M1/P and an interest rate of R1, the central-bank expands the money-supply to M2/P. Now, with a given level of national income/output at Y, the only way that people will want to hold the increased supply of money is if the cost of doing so is reduced, i.e. via a lower interest rate at R2. At that rate balance is restored and the LM curve shifts from L1 to L2.
Now, you might wonder why the expansion of the money-supply (a monetary policy boost) has had no effect on the level of national income in the diagram. Well, it will have an effect, but to show that I'd need to extend the analysis to the full IS-LM model, which I will do but on another page.
In Summary
- The LM curve is upward sloping and depicts equilibrium in the money-markets with a fixed money-supply, and varying levels of national income and interest rates.
- The slope of the LM curve depends on the responsiveness of money demand to those changes in national income and interest rates.
- An active monetary-policy that increases/decreases the real money-supply will similarly increase/decrease the LM curve in the same direction.
Criticisms
My main criticisms of the LM curve are similar to those that I gave for the IS curve i.e. there is no reliable way to know where these curves sit at any given moment, or even in which direction they are headed.
This is a huge practical problem, and one that is compounded by the fact that any policy action that is taken on the limited information available will only come into effect after a significant time delay, which could easily render the policy action either useless or counterproductive.
You might object to this and insist that the central-bank knows full well what the nominal money-supply is since it has sole control over the issuing of legal tender (cash) in the economy. However, money is more than just cash, credit also performs the critical function of money in these models i.e. it can be used to purchase goods and services. In reality, it is the high-street banks that cause most of the increases and decreases in the money-supply because credit is much more powerful than cash.
This makes the whole problem of keeping a stable money-supply more problematic, and introduces the problem of calculating broader measures of money and their relative impact on the economy.
In practice central-banks actually seek to control interest rates rather than the money-supply directly. This presents new problems for the model, because there are many things that influence the interest rate, not least of which is the demand for money (the L curve) which we cannot calculate with any degree of accuracy.
Similarly, changes in the price level are only recorded with significant delay, and are also imprecise, and will cause unpredictable movements in the money-supply in the short-term.
Then there's the fact that there is no single interest rate, there's an entire structure of interest rates that can move differently, although admittedly they do tend to move reasonably well together and in tandem with movements in the central-bank rate.
Related Pages:
About the Author
Steve Bain is an economics writer and analyst with a BSc in Economics and experience in regional economic development for UK local government agencies. He explains economic theory and policy through clear, accessible writing informed by both academic training and real-world work.
Read Steve’s full bio
Recent Articles
-
What Happens to House Prices in a Recession?
Jan 11, 26 03:13 AM
What happens to house prices in a recession? Learn how different recessions affect housing, why 2008 was unique, and how policy responses change home values. -
Does Government Spending Cause Inflation?
Jan 10, 26 06:01 AM
Does government spending cause inflation? See how waste, crowding out, and stimulus spending quietly push prices higher over time. -
What Happens to Interest Rates During a Recession
Jan 08, 26 05:31 PM
What happens to interest rates during a recession? Explore why rates often fall, when they don’t, and how inflation, policy, and markets interact. -
Circular Flow Diagram in Economics: How Money Flows
Jan 03, 26 04:57 AM
See how money flows through the economy using the circular flow diagram, and how spending, saving, and policy shape real economic outcomes. -
What Happens to House Prices During Stagflation?
Jan 02, 26 09:39 AM
Discover how house prices and real estate behave during stagflation, with historical examples and key factors shaping the housing market.