- Home
- Market Failure
- Marginal Social Cost

Marginal Social Cost & Private Cost (With Graphs)
The marginal social cost associated with the production and consumption of some goods and services is large enough that it deserves action by the government to correct it. The free-market will not account for costs that are external to sellers/buyers, meaning that it will generate sub-optimal outcomes when these costs are significant.
Social costs accrue to third parties, e.g. when pollutants harm the natural environment to the detriment of us all, and are not included within the firm's price that it charges its customers.
For example, if pollutants build up in a river and destroy the fish in that river, then the costs are borne by the fishermen who will be unable to catch fish.
By including these 'external costs' within the full costs of production calculation, an industry can move towards a more socially beneficial outcome. If it does not, then there will be a 'deadweight loss' for society as a whole.
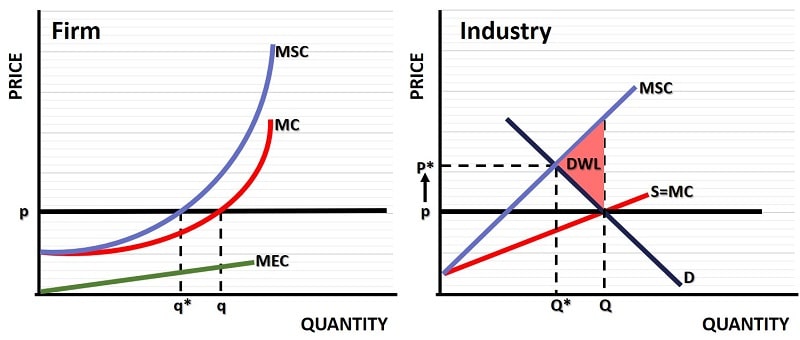
This is best illustrated with the use of a graph.
Marginal Social Cost Graph
On the left-side of the marginal social cost graph we analyse the price/output choices of a competitive profit maximizing firm within a larger industry. The right-side of the graph analyses the industry as a whole.

As in a typical competitive industry, an individual firm has no control over prices and simply adjust its output to the level at which its own marginal cost curve intersects the price line (p). At this point any further unit of output can only be produced at a higher cost than it can be sold for. This output level occurs at q as illustrated.
The industry price is determined by the intersection of the industry marginal cost curve, i.e. the supply curve or MC=S curve, and the industry demand curve (D), as illustrated on the right side of the graph. This results in an industry output level of Q, but this is not the optimal level of output because the external cost to third parties has not been accounted for.
The industry's marginal social cost curve intersects the demand curve at an output level of Q*, and at this optimal level of output the price charged per unit of output should be P*.
The original price/output point results in a deadweight loss (DWL) to society as illustrated by the red shaded area on the right-side of the graph.
Marginal Private Cost (MPC)
The marginal private cost curve is basically the standard marginal cost curve. Unfortunately, since it does not account for all costs of production, it leads to inefficiency whenever there are significant external costs of production/consumption.
The difference between marginal cost and marginal social cost is given by the green marginal external cost curve (MEC) on the left-side of the graph.
In the short run, given existing production facilities, the typical firm within this industry would produce an efficient level of output at q*, but as the right-side of the graph illustrates this is not a long-run equilibrium point because the price level will rise somewhat if the industry is forced (e.g. by a Pigouvian corrective tax) to account for the full costs of production.
The higher costs will lead to higher prices and less demand from consumers. Ultimately, either the number of firms in the industry will be reduced or the output levels of each firm will fall once equilibrium is reached. In practice there will probably be both a reduction in the number of firms and some reduction in the individual firm output rates, but this is not illustrated in the graph above.
Final Thoughts
The marginal social cost concept is important in any industry that has significant 'externalities', and for more information about that I'd encourage the reader to check out the links below.
Related Pages:
- Externalities in Economics
- Socially Optimal Quantity of Output
- Marginal Social Benefit
- Marginal Cost of Abatement
- Marginal External Cost
- Corrective Tax
- Marginal External Benefit
- Thinking At The Margin
- Types of Market Failure
About the Author
Steve Bain is an economics writer and analyst with a BSc in Economics and experience in regional economic development for UK local government agencies. He explains economic theory and policy through clear, accessible writing informed by both academic training and real-world work.
Read Steve’s full bio
Recent Articles
-
What Happens to House Prices in a Recession?
Jan 11, 26 03:13 AM
What happens to house prices in a recession? Learn how different recessions affect housing, why 2008 was unique, and how policy responses change home values. -
Does Government Spending Cause Inflation?
Jan 10, 26 06:01 AM
Does government spending cause inflation? See how waste, crowding out, and stimulus spending quietly push prices higher over time. -
What Happens to Interest Rates During a Recession
Jan 08, 26 05:31 PM
What happens to interest rates during a recession? Explore why rates often fall, when they don’t, and how inflation, policy, and markets interact. -
Circular Flow Diagram in Economics: How Money Flows
Jan 03, 26 04:57 AM
See how money flows through the economy using the circular flow diagram, and how spending, saving, and policy shape real economic outcomes. -
What Happens to House Prices During Stagflation?
Jan 02, 26 09:39 AM
Discover how house prices and real estate behave during stagflation, with historical examples and key factors shaping the housing market.