- Home
- Business Cycle
- Negative Output Gap

Negative Output Gap Analysis (with Graphs)
The nature of the negative output gap, and its associated economic problems, pretty much forms the entire basis for the development of macroeconomic theory. When the economy is underperforming, with lower than full-employment output levels, policymakers usually resort to stimulus packages.
The worst example of a negative output gap in modern times is given by the Great Depression of the 1930s, when the unemployment rate in the US soared to around 20%, and something like 30% of the entire money supply was destroyed by numerous bank failures at that time.
The hardship suffered by regular people was extreme, and it led to vociferous calls for the government to do more to make sure that such economic downturns could be avoided, or at the least mitigated. Obviously this is no easy task to achieve, but this is precisely the aim of Keynesian economics, the dominant branch of economics since the 1950s.
There, are of course, many competing ideas in economics, but the Keynesians have won the favor of out political leaders primarily because it offers a set of actions that can be taken, meaning that whether or not those actions are well-founded, the government can at least be seen to be doing something to fix any negative output gap that might appear, and in so doing gain appreciation (and votes) from the general population.
Negative Output Gap Graph
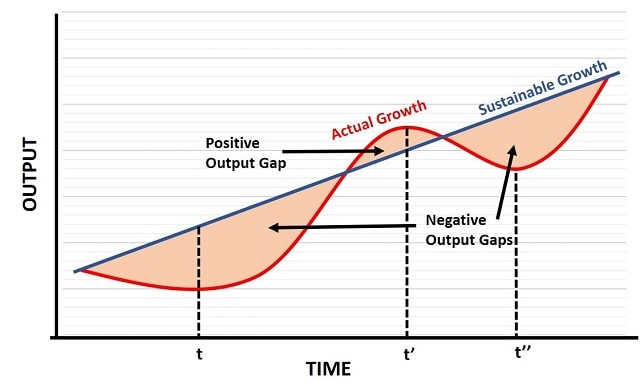
The nature of the business cycle is illustrated in the negative output gap graph below. The straight upward sloping blue line represents the long-run sustainable growth path of the economy, where full employment is always achieved.

Unfortunately, such a stable growth path as that depicted by the blue line is not often achieved in the real world. Growth tends to come in bursts for all sorts of reasons, e.g. a significant technological advancement that increases productivity capacity, or an increase in consumer confidence that leads to higher rates of spending.
In times when the economy is growing strongly and consumer confidence is high, it is quite typical for the housing market to start heating up with property prices rising fast. That can initiate the start of a housing bubble as some buyers seek to profit from speculative purchases, whilst others desperately seek to get on the property ladder while it is still affordable to do so.
Such bubble markets cannot be sustained indefinitely, and ultimately the economic boom times turn to bust, and spending levels drop. A recession follows and a negative output gap develops.
The red line in the graph above illustrates the typical economic growth path.
If we start at the beginning of the growth path where both the blue and red lines intersect, we can see that the economy is moving into a recession as time passes, with a big negative output gap developing. Visually, the graph illustrates this gap with the shaded area beneath the blue sustainable growth path and above the red actual growth path.
By time t, the recession has bottomed out and economic recovery begins, but the negative output gap persists until actual growth once again intersects the sustainable growth path. By time t' the actual growth has overshot sustainable growth, and a small positive output gap appears. However, the cyclical nature of the business cycle reaches another turning point at time t' and another recession develops, bottoming out at point t'' with another negative output gap.
Recessionary Output Gap Analysis
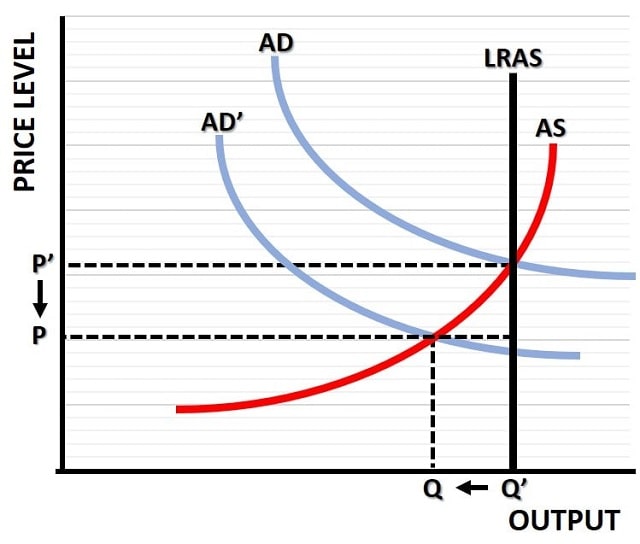
The term recessionary output gap is an alternative name that is sometimes used to explain a similar phenomena, but it is perhaps more closely associated with Keynesian theory since it relates to the level of aggregate demand and supply. In the graph below, we can see the Keynesian analysis of a recession due to a falling level of aggregate demand from AD to AD'.

According to Keynesian theory, the falling level of aggregate demand will cause falling output levels as illustrated by the move from Q' to Q in the graph.
The falling level of output implies that fewer employees will be needed for production, and so unemployment levels will increase.
Additionally, the falling aggregate demand also causes the price level to fall, and so we get a deflationary recession as occurred in the 1930s Great Depression. This analysis is fine as far as it goes, but it is incomplete.
The 1970s saw a large recessionary output gap develop due to falling aggregate supply rather than demand, and Keynesian stimulus policy at the time caused the already rising price level (due to supply-side constraints) to rise even faster, reaching an annual rate of around 20% at its peak.
Long Term Impact on Sustainable Growth
The detrimental consequences for the economy of Keynesian policies, i.e. policies that allow incompetent policymakers to 'buy' votes by loosening the level of fiscal and monetary responsibility, even at times when Keynes himself would have argued against such measures, have created the current long term debt crisis.
The level of fiscally irresponsible spending by successive governments on both sides of the political divide has deepened rather than mitigated the negative output gaps that have been experienced in recent decades, and the damage caused by this does cause a permanent loss of potential output i.e. the long term sustainable growth path of the economy is reduced by such policies.
Related Pages:
- Positive Output Gap Occurrences
- Cyclical Unemployment
- AD-AS Model
- Why is Inflation Bad?
- Aggregate Demand
- Aggregate Supply
- The Business Cycle
About the Author
Steve Bain is an economics writer and analyst with a BSc in Economics and experience in regional economic development for UK local government agencies. He explains economic theory and policy through clear, accessible writing informed by both academic training and real-world work.
Read Steve’s full bio
Recent Articles
-
What Happens to House Prices in a Recession?
Jan 11, 26 03:13 AM
What happens to house prices in a recession? Learn how different recessions affect housing, why 2008 was unique, and how policy responses change home values. -
Does Government Spending Cause Inflation?
Jan 10, 26 06:01 AM
Does government spending cause inflation? See how waste, crowding out, and stimulus spending quietly push prices higher over time. -
What Happens to Interest Rates During a Recession
Jan 08, 26 05:31 PM
What happens to interest rates during a recession? Explore why rates often fall, when they don’t, and how inflation, policy, and markets interact. -
Circular Flow Diagram in Economics: How Money Flows
Jan 03, 26 04:57 AM
See how money flows through the economy using the circular flow diagram, and how spending, saving, and policy shape real economic outcomes. -
What Happens to House Prices During Stagflation?
Jan 02, 26 09:39 AM
Discover how house prices and real estate behave during stagflation, with historical examples and key factors shaping the housing market.