- Home
- Production Possibilities Curve
- Marginal Rate of Transformation

Marginal Rate of Transformation (MRT) Formula & Graph
In economics, the marginal rate of transformation is a term that is used to describe the cost of one good in terms of another. There is, of course, a little more to it than that and the concept here makes some important assumptions. Most importantly, we assume that we are considering the rate of transformation at some point on the:
The PPC is an important concept that is worth being aware of, so click the link for details. As a heads up, we can regard it simply as the technically efficient production combinations of goods and services. Now, you might well wonder how this concept is of any use when an entire economy has endless types of goods and services to produce while the model illustrated in the graphs below considers only two alternative goods.
The two-good model is just a simplification that we use to make a general point. If it helps you can consider one good to be something specific, and the other good to represent all other goods. The logic is the same and does not change the fundamental points made.
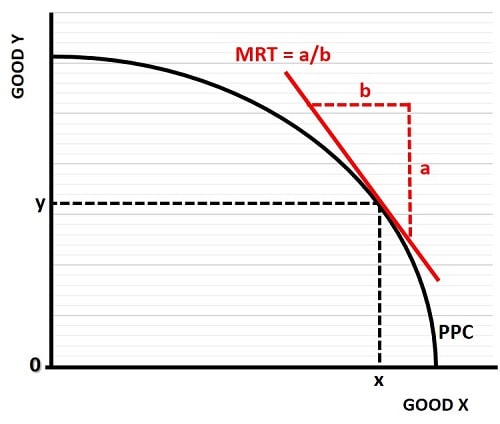
In the graph below, the dotted lines indicate a specific point on the PPC that relates to a production bundle of x,y. If any production bundle were chosen that lies inside, or below, the PPC then it would be possible to increase production of either good without having to reduce output of the other good. In this case the marginal rate of transformation is meaningless.

Similarly, if a production bundle were chosen that lies outside, or above, the PPC then the marginal rate of transformation is again meaningless, because that bundle is impossible to obtain. It is only for bundles of goods that lie on the PPC that the economy is producing at full capacity, with an increase in production of one good still possible, but only at the expense of reduced production of the other good.
The production bundle x,y is one such possible point, and the slope of the straight red line that touches the PPC at that x,y point is equal to the marginal rate of transformation.
Before continuing I should point out that the ideas here are closely related to the ideas behind the marginal rate of substitution, but in that case the ideas relate to consumers' preferred bundles of goods to consume, rather than firms preferred bundles of goods to produce.
The MRT Formula
The formula to calculate the marginal rate of transformation comes from the basic geometry of a triangle. In the graph above I've illustrated with dotted red lines (a) and (b). The marginal rate of transformation (MRT) is seen to be the hypotenuse of this triangle, and its slope is given by dividing the length of side (a) over the length of side (b) i.e. MRT = a/b. Technically, the slope here is a negative since it slopes downwards from left to right i.e. side (a) of the triangle is a negative number that measures a reduction in good y divided by a positive increase in good x.
From the MRT formula we need to consider what is represented by the triangle sides (a) and (b). With a little reflection the reader should quickly realize that side (a) represents the marginal cost of good (x). In other words, at point x,y on the PPC, the marginal cost of producing one more unit of good (x) is a/b multiplied by good (y). The reverse logic applies for the marginal cost of good (y) at this point on the PPC.
Marginal Rate of Transformation Equation & MRT Cost
If we substitute the marginal costs of good (x) and good (y) into the formula, we get the MRT equation:
MRT = MCx / MCy
In words this simply means that the marginal rate of transformation is equal to the marginal cost of producing one more unit of good (x), divided by the marginal cost of producing one more unit of good (y).
The Production Possibility Frontier & Rate of Transformation
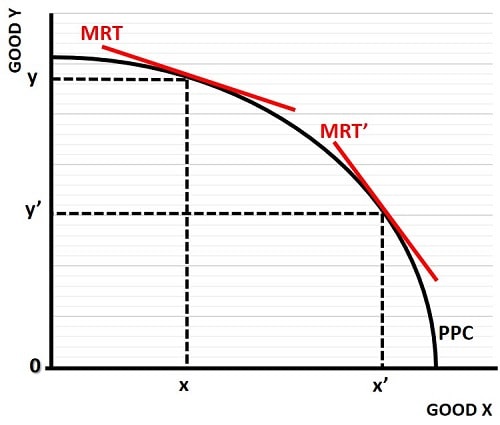
In the graph below I have illustrated two different MRT lines in order to show the important point that, at the production possibility frontier, the slope of the MRT gets increasingly steep the more that the economy produces good (x) at the expense of good (y).
This simply highlights the fact that, as an economy pours more and more of its resources into producing any given good, there is a diminishing rate of return. Some resources are better suited to producing good (y), and using them to produce good (x) will not yield the same productivity.

The production bundle x,y in this graph has an MRT with a low slope, illustrating that a large increase in good (x) can be achieved with only a small reduction in good (y). The bundle x'y' on the other hand shows that any further increase in output of good (x) will need to come with a large reduction in the output of good (y).
Conclusion
The marginal rate of transformation is an important concept to grasp for understanding how productive efficiency is achieved in an economy, however, so far I have said nothing about how consumers prefer one bundle of goods over another.
For that I encourage you to read my article about the marginal rate of substitution. An understanding of both these concepts will greatly enhance your understanding of general equilibrium analysis in the economy as a whole.
Related Pages:
- The Production Function
- Marginal Rate of Technical Substitution MRTS
- The Production Possibilities Curve
About the Author
Steve Bain is an economics writer and analyst with a BSc in Economics and experience in regional economic development for UK local government agencies. He explains economic theory and policy through clear, accessible writing informed by both academic training and real-world work.
Read Steve’s full bio
Recent Articles
-
What Happens to House Prices in a Recession?
Jan 11, 26 03:13 AM
What happens to house prices in a recession? Learn how different recessions affect housing, why 2008 was unique, and how policy responses change home values. -
Does Government Spending Cause Inflation?
Jan 10, 26 06:01 AM
Does government spending cause inflation? See how waste, crowding out, and stimulus spending quietly push prices higher over time. -
What Happens to Interest Rates During a Recession
Jan 08, 26 05:31 PM
What happens to interest rates during a recession? Explore why rates often fall, when they don’t, and how inflation, policy, and markets interact. -
Circular Flow Diagram in Economics: How Money Flows
Jan 03, 26 04:57 AM
See how money flows through the economy using the circular flow diagram, and how spending, saving, and policy shape real economic outcomes. -
What Happens to House Prices During Stagflation?
Jan 02, 26 09:39 AM
Discover how house prices and real estate behave during stagflation, with historical examples and key factors shaping the housing market.