- Home
- Consumer Behavior
- Marginal Rate of Substitution

Marginal Rate of Substitution (MRS) Example & Graphs
The marginal rate of substitution (MRS) is a concept in economics that relates to the amount of one good that a consumer is willing to sacrifice in order to obtain an extra unit of another good. It is usually used in conjunction with indifference curve analysis, as a way of modelling consumer behavior.
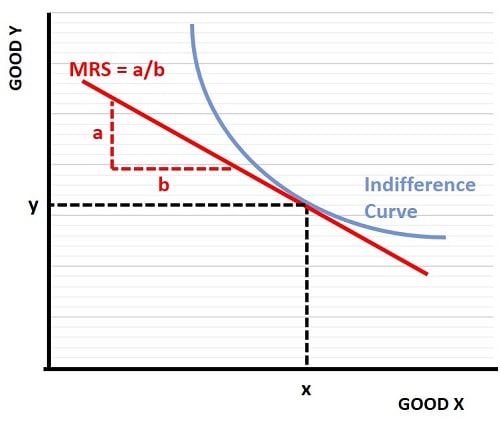
When illustrated via a graph, we express the MRS in terms of how much of the good depicted on the vertical y axis is sacrificed in order to get an additional unit of the good depicted on the horizontal x axis. This is shown in the graph below.
Since much of the analysis on this page assumes an understanding of indifference curves, a quick refresher on that topic may be useful. If so, have a look at my main article at:
In the graph below, we start with a consumer's indifference curve in the two-good model. As usual this is a downward sloping curve, but it slopes downward at a diminishing marginal rate. In other words the curve gets flatter as the consumption of good x increases. Intuitively we can understand why this might be the case, because the more of good x that a consumer enjoys relative to his consumption of good y, the more desirable good y will be compared to good x.

Economists would express this as the consumer having diminishing marginal utility from increasing quantities of a given good. Another way to put it is that, for a fixed amount of utility (utility is fixed along any specific indifference curve), when a consumer has a large amount of one good, he/she will be willing to give up a larger amount of it in order to obtain an extra unit of the other good. That being the case the curve gets flatter as we move along it from left to right.
In the graph, we can calculate the marginal rate of substitution by drawing a straight line that tangentially touches the indifference curve at the consumer's chosen bundle of goods. That bundle occurs at a consumption rate of y for good Y, and x for good X (as shown via the black dashed lines). The straight red tangent line that touches the indifference curve at this consumption bundle has a slope equal to the MRS. We then use the simple geometry of a triangle to deduce that the slope is equal to the length of side a divided by the length of side b as illustrated in the graph.
If we were to extend the red MRS line until it crosses the good Y and good X axes, we cab deduce another important conclusion i.e., that the MRS is equal to the ration of the two good's prices. For example, the MRS line crosses the good Y axis at the point where the consumer spends all of his/her income on good Y (and vice versa for good X). If the price of good Y were to fall then the line would cross that axis at a higher point since a larger quantity of good Y could be afforded.
From this we can deduce that the:
MRS = P(X)/P(Y)
In words, the marginal rate of substitution is equal to the price of good X (on the horizontal axis) divided by the price of good Y (on the vertical axis).
Diminishing Marginal Rate
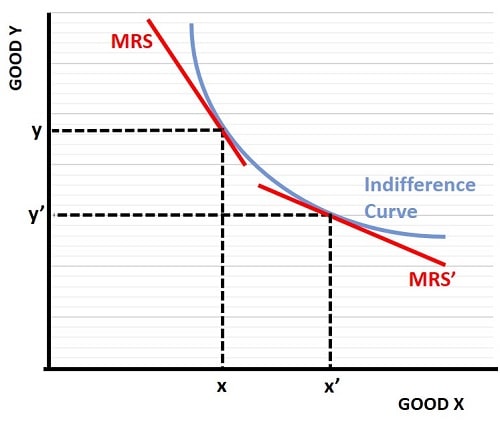
At any specific point along the curve, the MRS gets smaller as we move along it from left to right, because the MRS is equal to the slope of the indifference curve at any given point. With a consumption bundle of x,y in the graph below, the MRS line has a steep slope. When the consumer moves to a different bundle, with a change from x to x' and a change from y to y', the x'y' bundle yields a less steep MRS' line.
This illustrates the diminishing marginal rate of utility that the consumer gets from increasing amounts of x over y. As the curve gets flatter, the consumer will only wish to sacrifice a smaller and smaller amount of good y to get more of good x.

Marginal Rate of Substitution Example
To work through a simple marginal rate of substitution example, we need to use some mathematics. Economics is infamous for over-complicating its concepts by using advanced mathematics that are better suited to the physical sciences rather than economic science, but this one is very straight forward if you have a very basic grasp of calculus (if you don't have any knowledge of calculus, don't worry, just skip this section).
We start with a function that estimates the consumer's indifference curve. Let's say that, for quantities of good x between 1 and 16 units, consumption of good y can be approximated by the function: y = (x-20)^2
This quadratic equation can also be written in the form y = x^2 - 40x + 400. Now, using a first order derivative (dy/dx) we can calculate that the slope of the curve will be equal to 2x - 40. From the first equation i.e. y = (x-20)^2, we can calculate that when, for example, 2 units of good x are chosen, the consumer requires 324 units of good y to maintain his/her level of utility. At this point we use the first order derivative (2x - 40) to calculate that the MRS at this consumption bundle is -36. In other words, with 2 units of good x and an MRS of -36, the consumer is happy to give up 36 units of good y in order to get one more unit of good x.
Marginal Utility and the Rate of Substitution
Now, using the same method again, if 10 units of good x are chosen by the consumer, consumption of good y will be equal to 100 units. The MRS with this consumption bundle will be equal to -20, meaning that with an increased consumption of good x (10 units compared to only 1 in the first consumption bundle) the consumer is only willing to give up 20 units of good y to get an additional unit of good x. This is because of the marginal utility gained from the consumption of a normal good falls as its consumption increases, causing the preferred rate of substitution to fall with it.
In examples where there is no mathematical function given for the indifference curve, but there are several bundles with known quantities of each of the two goods under scrutiny, estimates of the MRS can be made by comparing the change in the consumption of goods that occurs between one bundle and the next. The estimates of MRS will be less accurate, because they will not represent a specific point on the curve. Instead, the straight MRS line will intersect two points on the curve, corresponding to two consumption bundles.
The result is a reasonable approximation of MRS if the two bundles are not too far apart. It gives a similar accuracy to the approximation of elasticity given by the arc elasticity of demand rather than the point elasticity of demand.
Marginal Rate of Substitution and the Budget Line
The marginal rate of substitution between two goods says nothing about the price of those goods, or the budget that the consumer has to work with. It turns out that, except in extreme cases, the cheapest consumption bundle that offers a utility optimizing combination of goods, occurs with a budget line that has an equal slope to the MRS. For further details about this, see my main article at:
MRS & Marginal Rate of Transformation (MRT)
The MRS also has nothing to say about the production side of the economy, and what combination of products the business community will prefer to supply. The MRT describes how the business community allocates its resources into the production of one good over another.
Interestingly, it turns out that at the optimal point of efficiency, the slope of the MRT line also matches the slope of the MRS line, and so you can probably start to realize that all these concepts form an interrelated model of both supply and demand. For more details on the MRT, see my main article at:
Related Pages:
- Consumer Behavior
- Price Consumption Curve
- Revealed Preference
- Engel Curves
- The Intertemporal Budget Constraint
- Complementary Goods & Substitute Goods
- Marginal Rate of Technical Substitution MRTS
About the Author
Steve Bain is an economics writer and analyst with a BSc in Economics and experience in regional economic development for UK local government agencies. He explains economic theory and policy through clear, accessible writing informed by both academic training and real-world work.
Read Steve’s full bio
Recent Articles
-
What Happens to House Prices in a Recession?
Jan 11, 26 03:13 AM
What happens to house prices in a recession? Learn how different recessions affect housing, why 2008 was unique, and how policy responses change home values. -
Does Government Spending Cause Inflation?
Jan 10, 26 06:01 AM
Does government spending cause inflation? See how waste, crowding out, and stimulus spending quietly push prices higher over time. -
What Happens to Interest Rates During a Recession
Jan 08, 26 05:31 PM
What happens to interest rates during a recession? Explore why rates often fall, when they don’t, and how inflation, policy, and markets interact. -
Circular Flow Diagram in Economics: How Money Flows
Jan 03, 26 04:57 AM
See how money flows through the economy using the circular flow diagram, and how spending, saving, and policy shape real economic outcomes. -
What Happens to House Prices During Stagflation?
Jan 02, 26 09:39 AM
Discover how house prices and real estate behave during stagflation, with historical examples and key factors shaping the housing market.