- Home
- Consumer Behavior
- Marginal Utility

Marginal Utility Explained (Graphs, Formula & Examples)
The concept of marginal utility in economics is one which explains how consumers gain additional satisfaction from the last unit of a good or service that they consume, and how they seek to purchase the basket of goods that will offer them the most satisfaction possible given their limited incomes.
Total utility maximization occurs at the point where the additional marginal utility gained from a dollar spent on one good is equal to the marginal utility gained from a dollar spent on any and all other goods. On this page I will explain this important concept in detail, because it forms an important foundation of microeconomic theory upon which many other models are built.
For anyone who wishes to read up on some of the important related concepts in economics that underpin the work on marginal utility, have a look at:
- The Budget Line & Budget Constraint
- The Indifference Curve & Indifference Map
- The Marginal Rate of Substitution
- The Utility Function
To start, let's consider one of the first things that we ought to know about consumption i.e., the law of diminishing marginal utility.
Law of Diminishing Marginal Utility Example
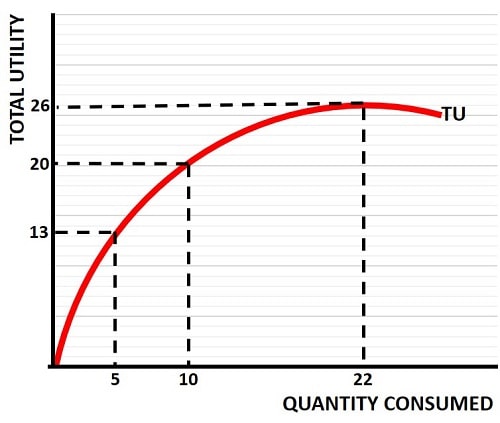
The law of diminishing marginal utility states that the extra satisfaction gained from an extra unit of consumption (of a normal good) is less than the satisfaction gained from the previous unit. This concept is most easily demonstrated with a graph.

In the diminishing marginal utility graph above, we can see that the slope of the total utility line (TU) gets less and less steep as we move along it from left to right. This illustrates that as the quantity of a normal good increases, it yields a smaller and smaller amount of extra utility.
With a quantity consumed of 5 units, it comes with a total utility level of 13. When the quantity consumed doubles to 10, the utility level increases but only to 20 i.e., significantly less than double. As the consumption level increases, the total utility curve gets flatter, and the extra utility only increases by a smaller and smaller amount until it reaches its limit.
Positive Marginal Utility & Negative Marginal Utility
As the graph above illustrates, there is a level beyond which no further utility is gained from further consumption, and we can call this the total utility maximization point. In the graph this occurs at a consumption of 22 units, and the total utility level at this point is 26.
We should note that consumption here does not necessarily mean that we directly consume the good ourselves e.g. if the good in question is chocolate bars, we don't need to eat them all, we can give some to our family or friends and gain some utility via their appreciation of our gift. However, within the definition of consumption we exclude the option of selling the chocolate to other people - that would violate our model as the consumption would then be someone else's.
For this reason, at some point, further consumption becomes a burden to us and total utility will begin to decline. Beyond a quantity of 22 units of consumption we start to experience negative marginal utility, because an additional unit of consumption will cause total utility to fall. For all units up to and including this point, total utility increased and therefore we gained positive marginal utility.
I should note an important point here i.e., in economics we always assume that our models are operating in the positive marginal utility section of the graph above. In other words, we always assume that more is better. I've set out this, and other key assumptions, on my page about Consumer Behavior, and it is always important to keep them in mind.
How to Calculate Marginal Utility
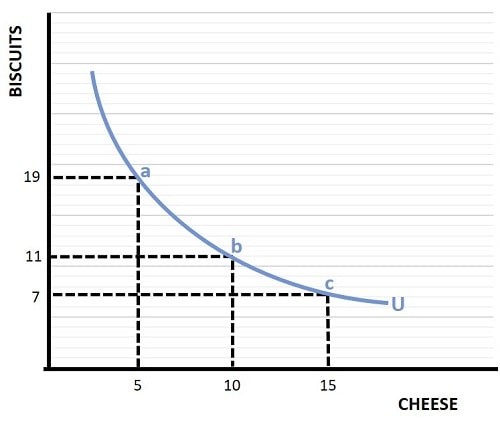
From a visual perspective, with the use of graphs, I have already illustrated the utility maximization level of consumption in the two-good model on my page about the Budget Line, but without repeating myself let's have another quick look at the indifference curve below.

The indifference curve shows all combinations of goods for which the consumer is equally satisfied, i.e., where utility is constant. On this curve, starting at point (a), a consumer can gain more utility by increasing his/her consumption of cheese from 5 units to 10 units by moving to point (b), but this simultaneously incurs an equal loss of utility from reduced consumption of biscuits from 19 units to 11 units. A further increase of cheese consumption from 10 to 15 units, requires another reduction of biscuits, albeit a smaller reduction, from 11 units to 7 units.
The smaller reduction fits with my earlier explanation of diminishing marginal utility i.e., the utility gained from increased cheese consumption in this example gets smaller but the utility lost from decreased consumption of biscuits increases as the two goods become more abundant or more scarce respectively.
The Marginal Utility Formula
We can also express what is happening as we move along an indifference curve via a marginal utility formula. As we move from point (a) to point (b) on the indifference curve above, we denote the change in cheese consumption as ΔC and the change in biscuit consumption as ΔB. Now, we can formulate the change in utility as:
0 = ΔC(MUc) + ΔB(MUb)
In words this means that the change in cheese consumption multiplied by the marginal utility of cheese, plus the change in biscuit consumption multiplied by the marginal utility of biscuits, equals zero. We know that the utility is constant, thus we know the overall change adds up to zero.
Next, a rearrangement of the formula above gives ΔC(MUc) = -ΔB(MUb) which can further be rearranged to MUc/MUb = -ΔB/ΔC. Finally, if you have read my article about the marginal rate of substitution (MRS), you may recognize that -ΔB/ΔC is just another way of expressing that concept. So, this means that we can substitute MRS into the formula at this point and get:
MUc/MUb = MRS
Furthermore, since we know from my article about the MRS that it is also equal to the ratio of the prices of the two goods i.e. MRS = P(c)/P(b), we can next substitute this into the formula and get MUc/MUb = P(c)/P(b) which easily rearranges to our final formula:
MUc/P(c) = MUb/P(b)
This formula tells us some important information about utility maximization, and it relates to a concept called the 'equimarginal principle'.
Total Utility Maximization & the Equimarginal Principle
The equimarginal principle, or equal marginal principle as it is sometimes called, is a very simple expression of what we might intuitively understand already i.e., that total utility is maximized, for any given budget, where a unit of income spent on one good generates an equal amount of extra marginal utility as a unit of income spent on any/all of the other goods/services that we choose to purchase.
If this were not the case, and our current consumption basket included a product that would give us a larger amount of utility for an extra unit of income than we would lose from spending one unit of income less on another good, we would immediately choose to make that switch.
Why would we willingly choose to spend a unit of income on a good that gives us less satisfaction than if we were to spend it on some other good? It would make no sense, hence we choose to allocate our income expenditure such that we gain as much utility from a dollar of one good as we do from a dollar's worth of any of the other goods we purchase. This is exactly what the marginal utility formula MUc/P(c) = MUb/P(b) is stating.
Related Pages:
- Revealed Preference
- The Price Consumption Curve
- The Engel Curve
- Thinking At The Margin
- Consumer Behavior
About the Author
Steve Bain is an economics writer and analyst with a BSc in Economics and experience in regional economic development for UK local government agencies. He explains economic theory and policy through clear, accessible writing informed by both academic training and real-world work.
Read Steve’s full bio
Recent Articles
-
What Happens to House Prices in a Recession?
Jan 11, 26 03:13 AM
What happens to house prices in a recession? Learn how different recessions affect housing, why 2008 was unique, and how policy responses change home values. -
Does Government Spending Cause Inflation?
Jan 10, 26 06:01 AM
Does government spending cause inflation? See how waste, crowding out, and stimulus spending quietly push prices higher over time. -
What Happens to Interest Rates During a Recession
Jan 08, 26 05:31 PM
What happens to interest rates during a recession? Explore why rates often fall, when they don’t, and how inflation, policy, and markets interact. -
Circular Flow Diagram in Economics: How Money Flows
Jan 03, 26 04:57 AM
See how money flows through the economy using the circular flow diagram, and how spending, saving, and policy shape real economic outcomes. -
What Happens to House Prices During Stagflation?
Jan 02, 26 09:39 AM
Discover how house prices and real estate behave during stagflation, with historical examples and key factors shaping the housing market.