- Home
- Consumer Behavior
- Engel Curve

The Engel Curve in Economics, Explained (with Graphs)
The Engel Curve in economics relates the demand for a good to the income level of the consumer and, as you might expect, for normal goods we find that a rising income leads to an increasing amount of demand. However, there are some goods, called inferior goods, for which a rising income yields a decreasing level of demand.
Even for normal goods the responsiveness of demand to income changes varies from one good to another, and in this article I will show that it is even the case that any given good may be regarded as a normal good at some income levels, and inferior at other levels.
Closely related to the Engel curve is the income consumption curve. I have previously written about the price consumption curve, from which we can derive a consumer demand curve with prices held constant, and the income consumption curve has complementary uses in that it can be used to derive shifts in demand when prices are held constant.
The Income Consumption Curve
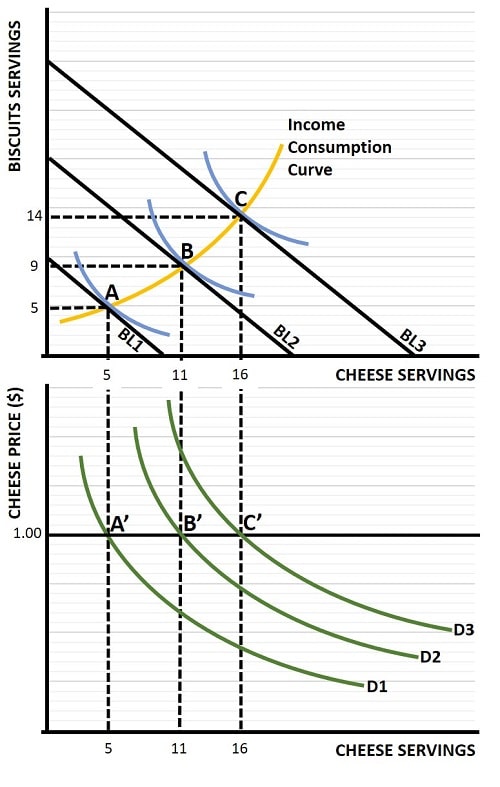
In the graph below I have illustrated a typical income consumption curve that results from steadily increasing income levels for a consumer. As in other articles I have again used the two goods cheese and biscuits to represent a consumer's only available options on which to spend his/her money. We also continue to assume that all available income is allocated to purchase one or the other of these two goods. For more information about the relevant standard assumptions used in elementary economics, have a look at my article about consumer behavior.

As illustrated in the top half of the graph, we start with three different budget lines representing three different income levels. If we take the price of cheese servings and biscuits servings to both equal $1.00 each, budget line 1 (BL1) shows how a $10 income will be allocated, whilst BL2 and BL3 relate to incomes of $20 and $30 respectively.
Still in the top half of the graph, we can see that the consumer chooses to increase his/her purchasing of cheese servings from 5 to 11 and the 16 servings as the budget is increased from $10 to $20 and finally to $30. Similarly, spending on biscuits servings increases from 5 to 9 and finally to 14 servings.
Now, on the bottom half of the graph we focus only on cheese servings at the fixed price of $1.00 per serving. The three different demand curves illustrated represent the consumer's preferred consumption of cheese servings at each income level. We assume that cheese is a normal good and that the relevant demand curve is downward sloping i.e. that a lower price of cheese would elicit higher consumption, and we illustrate that at three different income levels, demand shifts outwards and to the right as income increases. Recall that to derive the downward sloping demand curve we need to use the price consumption curve rather than the income consumption curve.
To derive the income consumption curve, we return to the top half of the graph and we plot each of the preferred consumption bundles that result from the different income levels. As can be seen, this results where the highest possible indifference curves (shown as the blue curves) touch the three budget lines i.e., at points A, B & C respectively. Drawing a curve through all such points, at all possible income levels, yields the income consumption curve.
Normal Good & Inferior Good Preferences
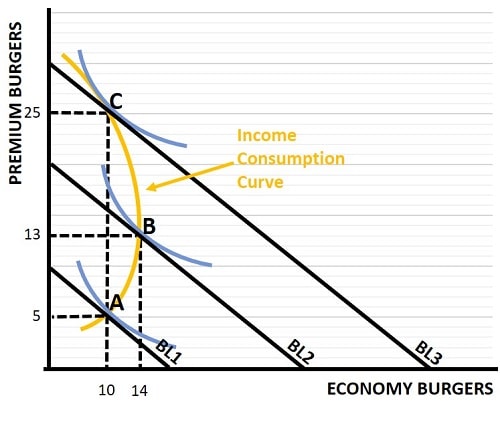
Not all income consumption curves slope upwards in the manner illustrated above, and it is frequently the case that the curve will start to bend backwards at higher income levels. In the graph below I illustrate this with reference to preferred consumption bundles of economy burgers and premium burgers at different income levels.

Imagine that the price of economy burgers is $1.00 each and the price of premium burgers is $2.00 each. BL1, BL2 and BL3 represent income levels of $20, $40 and $60 respectively. At the lower income level, consumption bundle A represents a preferred consumption of 5 premium burgers and 10 economy burgers.
When income increases to $40, consumption of both types of burgers increases such that 13 premium burgers and 14 economy burgers are purchased. However, when income increases to $60, the consumer prefers to allocate a reduced amount of income to economy burgers in favor of premium burgers. This is illustrated by consumption bundle C with 25 premium burgers and only 10 economy burgers. The resulting income consumption curve is backward bending from bundle B to bundle C.
In economics jargon, we state that above an income level of $40, economy burgers are an inferior good because the consumer prefers to consume a decreasing amount of them as his/her income increases.
Engel Curves
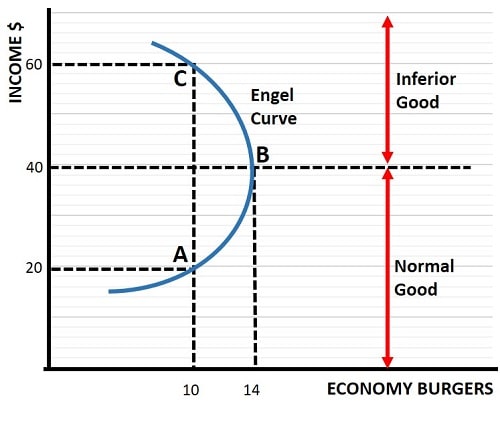
The Engel curve is useful for illustrating the concept of normal goods and inferior goods because it plots a particular good on the horizontal axis against income on the vertical axis. In the Engel curve graph below we can see the familiar upward slope for a normal good followed by a backward bending section for inferior goods.

Points A, B & C in the graph correspond to the preferred consumption bundles of premium burgers and economy burgers in the previous graph, but the Engel curve only focuses on economy burgers at various income levels.
When the Engel curve is upward sloping, the good under inspection is consumed as a normal good with increasing consumption as income rises. When the Engel curve starts to bend backwards, above an income level of $40 in the graph, economy burgers exhibit inferior good characteristics.
Inferior goods are common in all economic systems because people do not just want extra quantities of goods as their incomes rise, they also desire better quality. It doesn't just apply to food items; a consumer might prefer more and more expensive faraway destinations for their vacations in place of fewer local vacations, or new cars in preference to used cars. Above some income level, we might prefer to substitute a larger amount of consumption of private healthcare services in place of cheaper alternatives, the same can be said of private-education over public-education for our children, and so on, the list is endless.
One of the key points that the Engel curve helps us to understand is that many goods may be classed as inferior goods for consumers who have a high enough income - it is not the case particular goods are inferior in and of themselves, it all relates to income.
Engel's Law & Family Expenditure Economics
The Engel curve is named after Ernst Engel who in the mid 19th century conducted research into family expenditure patterns at different levels of income. His conclusions, known as Engel's law, assert that:
- A higher family budget results in more money being spent on food, but at a decreasing proportion of income.
- A higher family budget leads to a proportional increase in spending on clothing, rent, lighting and fuel
- A higher family budget leads to an increasing proportion of income being spent on education, health and recreation.
Although this research is almost 200 years old, the central message is still relevant today, and it is unlikely to change anytime soon. People will first spend their incomes on the basic necessities of life because of the high (but diminishing) marginal utility of those goods. Only as income levels increase will the less necessary, more luxurious goods, start to account for a growing proportion of overall spending. In other words, basic necessities have a low income elasticity of demand while luxury goods have a high income elasticity of demand.
At a national level, the proportion of income spent on food, known as the 'Engel Coefficient', is sometimes used as a measure of that nation's standard of living. When a country experiences economic growth, the Engel Coefficient falls, and when a country gets poorer the coefficient rises. There are, of course, changing patterns in the types of food consumed when income changes, and 'Bennett's Law' notes that consumption moves more towards nutrient-dense high quality foods as income rises, in preference to cheap staple foods like rice and potatoes.
The Engel curve is an extension of Engel's law, and it illustrates the relationship between income and spending on a particular good. The slope of the Engel curve for that good reveals its income elasticity of demand, and a positive value vs a negative value reveals whether the good is a normal good or an inferior good at an associated income level.
Sources:
Related Pages:
- Price Consumption Curve
- The Marginal Rate of Substitution
- Income Effect
- Substitution Effect
- Income Elasticity of Demand
- Consumer Behavior
About the Author
Steve Bain is an economics writer and analyst with a BSc in Economics and experience in regional economic development for UK local government agencies. He explains economic theory and policy through clear, accessible writing informed by both academic training and real-world work.
Read Steve’s full bio
Recent Articles
-
What Happens to House Prices in a Recession?
Jan 11, 26 03:13 AM
What happens to house prices in a recession? Learn how different recessions affect housing, why 2008 was unique, and how policy responses change home values. -
Does Government Spending Cause Inflation?
Jan 10, 26 06:01 AM
Does government spending cause inflation? See how waste, crowding out, and stimulus spending quietly push prices higher over time. -
What Happens to Interest Rates During a Recession
Jan 08, 26 05:31 PM
What happens to interest rates during a recession? Explore why rates often fall, when they don’t, and how inflation, policy, and markets interact. -
Circular Flow Diagram in Economics: How Money Flows
Jan 03, 26 04:57 AM
See how money flows through the economy using the circular flow diagram, and how spending, saving, and policy shape real economic outcomes. -
What Happens to House Prices During Stagflation?
Jan 02, 26 09:39 AM
Discover how house prices and real estate behave during stagflation, with historical examples and key factors shaping the housing market.